Statistics dashboard: understanding your account metrics
The statistics dashboard provides a read-only summary of marketplace performance, monitored catalog coverage, competitor activity, and recent account processes.
What the statistics dashboard is for
The statistics dashboard gives you a quick overview of what B2BLIX has recently discovered and processed for your account. It is intended for reviewing account-level information rather than investigating one specific product.
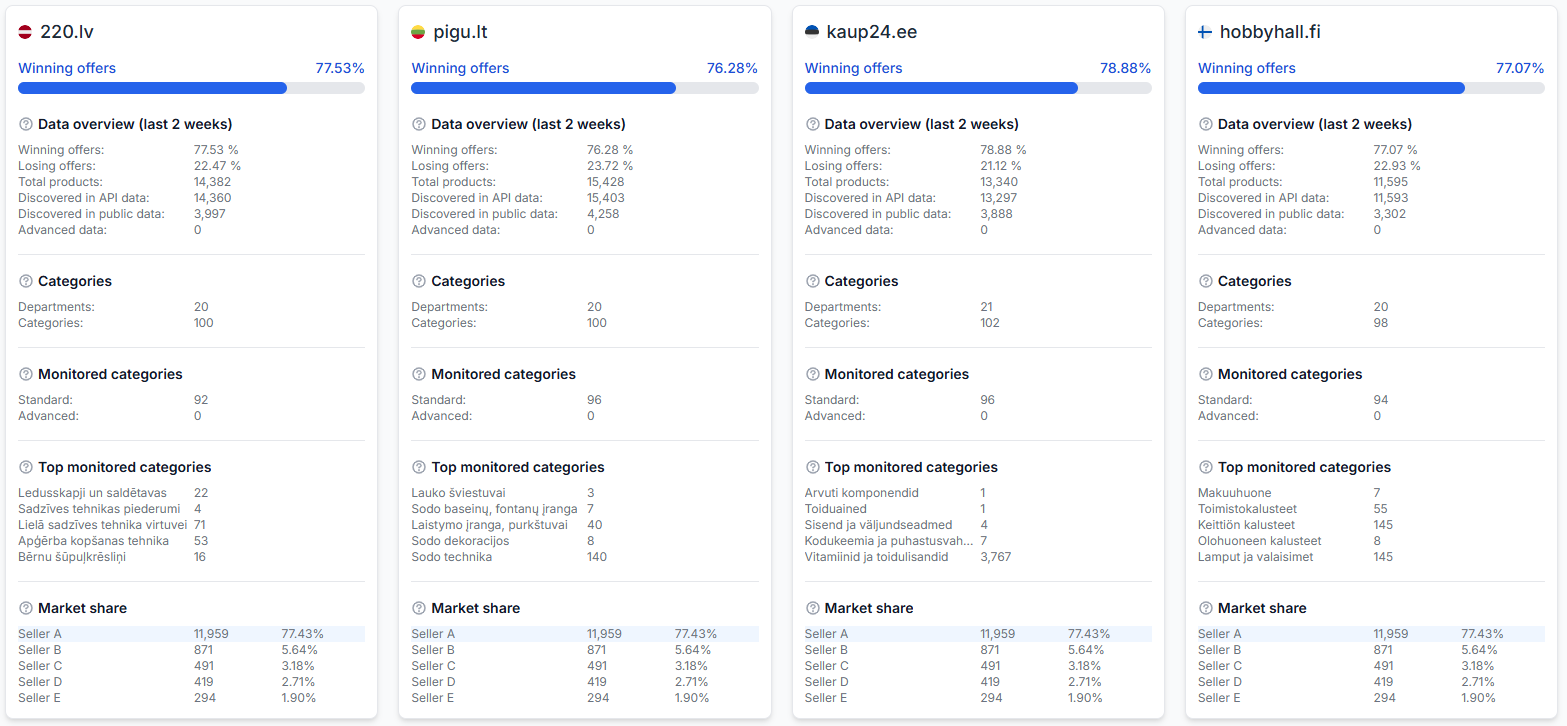
Each supported marketplace is displayed in a separate localized card. You only see cards for marketplaces in which your seller account participates. For example, a seller operating in Latvia, Lithuania, and Estonia would normally see cards for 220.lv, Pigu.lt, and Kaup24.ee, but not HobbyHall.fi.
The marketplace statistics are generally based on activity from the last two weeks. The page also shows recent background processes and synchronization information associated with the account.
What you can do on this page
The statistics dashboard is an informational, read-only interface. You can use it to:
- Review the percentage of recently discovered winning and losing offers.
- Compare product discovery totals from API data and public marketplace data.
- See how many departments and categories have been discovered.
- Check how many categories are being monitored in standard or advanced mode.
- Identify the monitored categories containing the most products.
- Review a summary of leading sellers found in recent marketplace observations.
- Check recent background process and synchronization statuses.
There are no pricing fields, switches, save buttons, or other controls that change your account configuration on this page. Configuration changes must be made in the relevant settings or management interface.
Marketplace cards
Each marketplace card uses the same general structure. The figures are calculated separately for that marketplace, so the totals and percentages can differ between countries.
Information icons beside section headings provide short explanations of the displayed metrics.
Winning offers indicator
The progress bar at the top of each card shows the percentage of recently discovered offers classified as winning offers for your seller account.
The classification is based on marketplace information discovered by B2BLIX and the seller identity associated with the account. It represents observed data from the displayed period, not a guarantee of the current BuyBox position for every product.
Important: B2BLIX cannot guarantee a 100% winning rate. The marketplace selects the BuyBox winner, and some positions may not be achievable within your minimum price limits, maximum price limits, or selected pricing strategy.
Main statistics explained
| Section or metric | What it means | How to interpret it |
|---|---|---|
| Winning offers | The percentage of discovered offers where your account was identified as winning during the displayed two-week period. | Use it as a general performance indicator. It is based on observed marketplace data and may change as new information is collected. |
| Losing offers | The percentage of discovered offers where another seller was identified as winning. | A losing offer does not necessarily indicate an error. Your pricing boundaries or strategy may intentionally prevent the system from matching a lower competing price. |
| Total products | The total number of products gathered for the marketplace from the available API and public data sources. | Use this figure to understand the overall catalog coverage currently known to B2BLIX. |
| Discovered in API data | The number of products found through the connected marketplace API data. | This reflects one source of product discovery and should not be treated as a separate catalog that must be added to the public-data total. |
| Discovered in public data | The number of products found in publicly available marketplace information. | A product may be present in more than one source, so source totals can overlap. |
| Advanced data | The number of products monitored in advanced mode, including additional information such as second-place price tracking. | A value of zero means that no products in that marketplace are currently represented in this advanced-data count. |
| Departments | The number of discovered department groups in the marketplace. | A department is a broader group that can contain categories and subcategories. |
| Categories | The number of categories discovered in public marketplace data. | This is the known category coverage for the marketplace and may grow as additional products and categories are discovered. |
| Monitored categories: Standard | The number of categories whose products are monitored using a configured standard monitoring frequency. | This indicates active monitoring coverage. Monitoring frequency and category selection are configured elsewhere. |
| Monitored categories: Advanced | The number of categories monitored using advanced mode. | Advanced monitoring may collect additional competitive information. This dashboard only reports the count and does not enable or disable the mode. |
| Top monitored categories | The five monitored categories containing the highest number of products. | The number beside each category is its product count. The complete monitored-category list is available in Category Management. |
| Market share | A list of leading sellers, including your account, calculated from marketplace discoveries over the last two weeks. | Each listed seller is shown with a count and percentage for the dashboard’s recent comparison. Your own seller row may be highlighted. |
Background processes and recent synchronization
The dashboard also presents technical account activity in a simplified status format. This helps you confirm that expected background work has recently taken place without opening a detailed report.
Recent synchronization information can include:
- Scheduled time: When the synchronization or background process was planned to run.
- Status: The latest displayed state or result of the process.
- Import source: Where the seller’s product information was imported from.
- Destination: Where the prepared result was sent or generated, such as an XML output or a supported API export.
These entries report activity only. They do not allow you to change the synchronization source, schedule, or output method from the statistics dashboard.
A completed calculation or export does not necessarily mean that a price is already live on the marketplace. Monitoring, synchronization, calculation, export, and marketplace publication are separate stages.
How to interpret the dashboard safely
-
Check the marketplace card.
Make sure you are reading the card for the correct country. Each marketplace has separate products, categories, observations, and results.
-
Confirm the reporting period.
Winning, losing, and market-share information is presented as a recent summary, normally covering the last two weeks. It should not be interpreted as a second-by-second live result.
-
Review coverage before judging performance.
Check the product and monitored-category totals. A percentage based on limited or newly collected data may not yet represent the seller’s wider catalog.
-
Compare trends rather than expecting a fixed target.
The winning percentage may improve after the account has been active for several monitoring cycles, but the result still depends on your catalog, pricing policy, competitors, monitoring configuration, and permitted price ranges.
-
Check process statuses separately.
A marketplace-performance metric and a synchronization status describe different parts of the service. A successful synchronization does not guarantee a winning position.
Common mistakes
-
Expecting a 100% winning rate.
Some competing prices may be below your permitted minimum price. In that situation, protecting the configured price boundary can be more important than winning the position.
-
Treating the dashboard as a live BuyBox checker.
The cards summarize recently discovered information. Use product-level information when you need to examine one specific EAN or pricing decision.
-
Adding API and public discovery totals together.
The same product can appear in both sources. The two source counts are not necessarily separate, non-overlapping catalogs.
-
Comparing marketplace percentages without checking catalog size.
A marketplace with fewer products or different monitored categories may produce a very different percentage from another marketplace.
-
Assuming a new account immediately has complete statistics.
Product, category, and performance information develops as B2BLIX discovers marketplace data and completes scheduled monitoring cycles.
-
Looking for configuration controls on this page.
The statistics dashboard is read-only. Monitoring frequencies, synchronization settings, pricing strategies, and export methods are managed in their respective interfaces.
Example use case
A seller operates on 220.lv, Pigu.lt, and Kaup24.ee. The seller opens the statistics dashboard for a weekly account review and sees three marketplace cards.
The seller first compares the winning-offer percentages. One marketplace has a lower percentage, so the seller checks its total products, monitored-category coverage, and top monitored categories. The seller then reviews the market-share list to understand the recent competitive distribution.
Finally, the seller checks the recent synchronization status to confirm that product data was imported and that the expected XML or API output process ran. No settings are changed on this page. Any later adjustment to monitoring or pricing rules is made in the appropriate configuration interface after reviewing the relevant product and category information.